Tagless Real-Time Attribution of cloud egress and compute costs.
See what your cloud bill is hiding.
Where Pod-level metrics stop. We don't!
See exactly which Service is driving your Cloud Bill: Namespace → Pod → Container → Process → Cost
No code changes. No Billing API dependency. Only 2 mins to install. Start saving on Cloud Costs Immediately.
▶ Start Free Trial Try the Live SandboxBuilt for FinOps and Engineering teams who need cloud cost visibility that pod-level tools and billing-API dashboards can't deliver — without the tagging discipline most platforms require.
- ✓ Tagless cost attribution — Sentrilite tracks every metric at the kernel level, so no manual tagging or labeling is required. Get accurate per-service, per-node, and per-cluster cost breakdown instantly.
- ✓ More granular than pod or container level — attribution goes below the container to the exact service and endpoint making each call, with call counts and data volumes per destination.
- ✓ No code changes. No API credentials. No billing API dependency — Sentrilite works entirely from the server, below the application and SDK layer.
- ✓ Single dashboard for your entire infrastructure — AWS, GCP, Azure, on-prem, bare metal, VMs, containers, inside or outside Kubernetes — all in one report.
- ✓ Real-time cost spike alerts — get alerted the moment a service starts generating anomalous traffic, cross-region transfers, or unexpected API calls — before it becomes next month's surprise bill.
- ✓ Catches cost leaks from unauthorized workloads — crypto miners, runaway jobs, and compromised services driving compute and egress costs show up immediately.
- ✓ One command to install. One click to generate the report — no setup, no configuration, no onboarding call required.

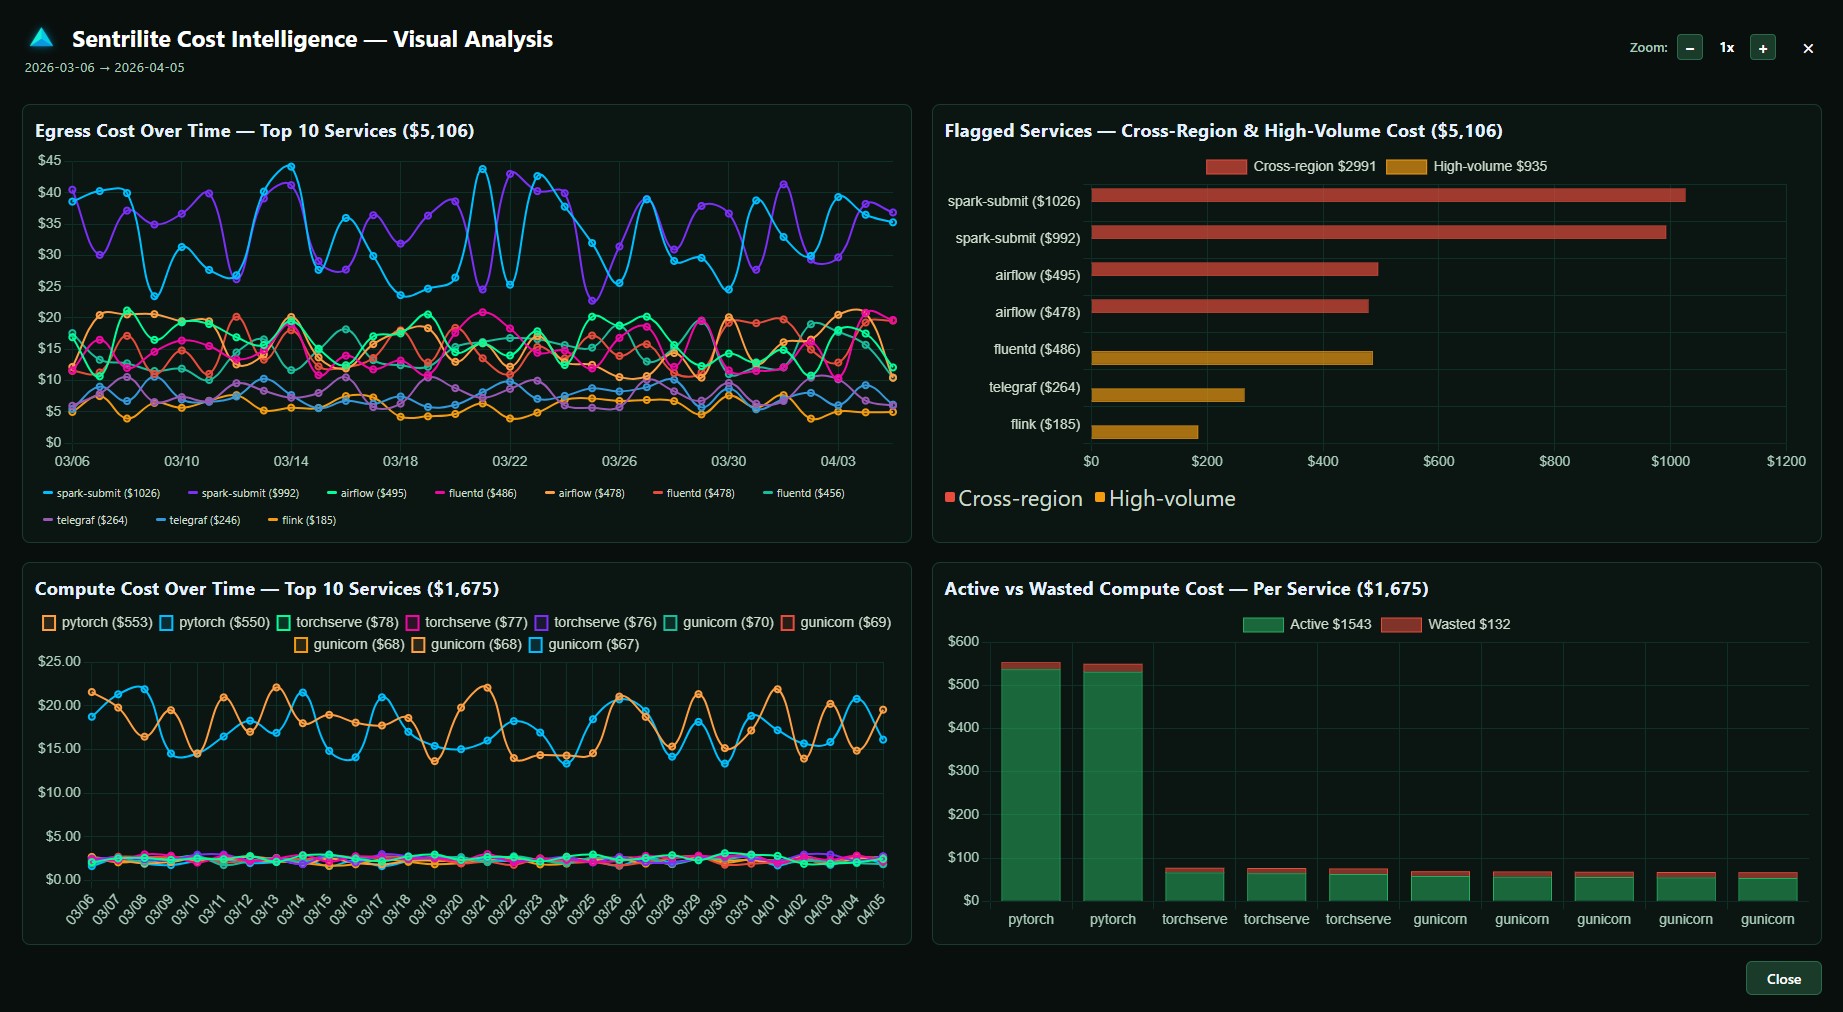
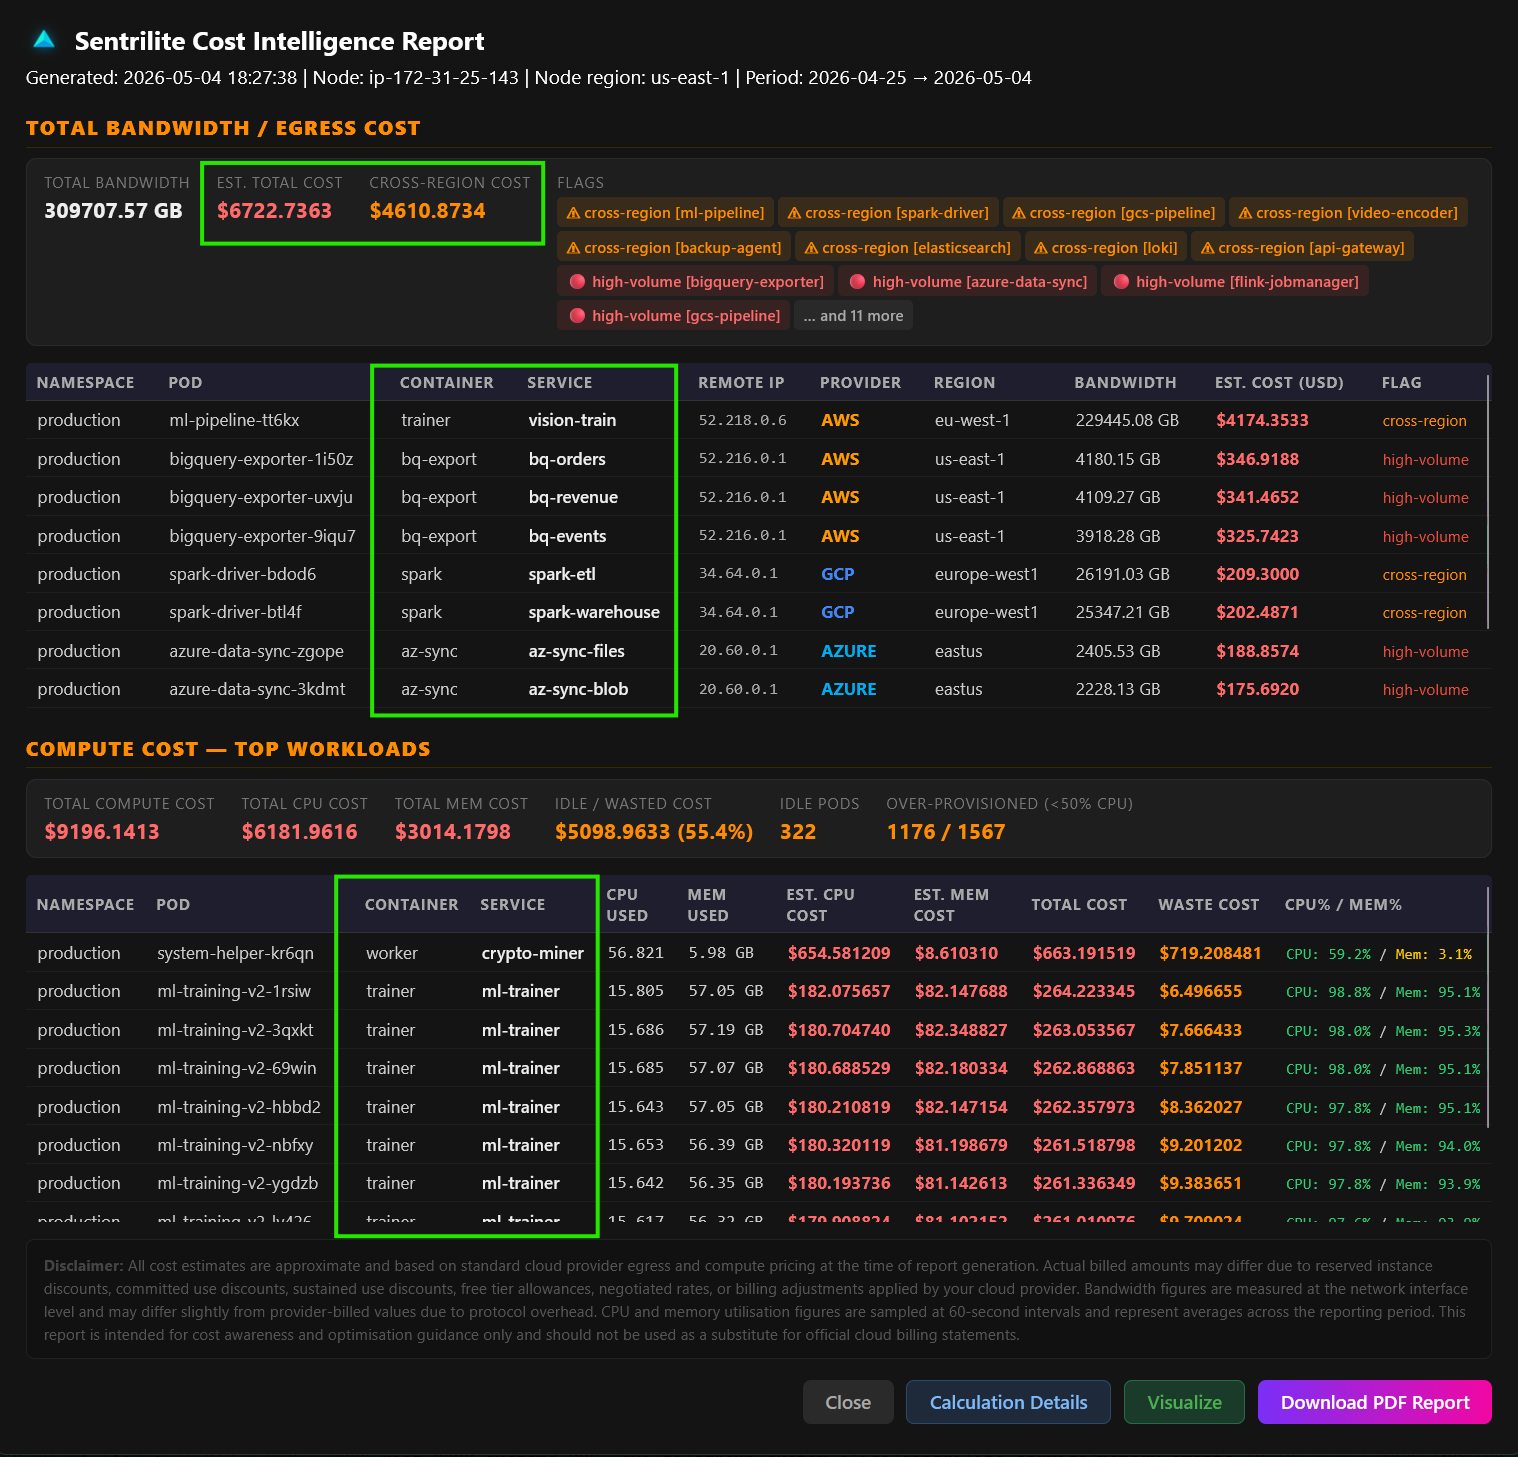
Click to enlarge · Actual report from a live deployment
How It Works
Sentrilite runs two independent data pipelines on every monitored node — one for network egress cost attribution, one for compute cost attribution. Both read directly from the Linux kernel with no application instrumentation required.
Capture Every Connection
Every outbound network call from every process is captured at the kernel level — including calls made by background threads, SDKs, and third-party libraries you didn't write.
Resolve to Cloud Services
Destination IPs are resolved against official AWS, GCP, and Azure IP ranges — so the report shows S3, DynamoDB, GCS, Azure Blob, not raw IP addresses.
Attribute to Processes & Pods
Every egress call is attributed to the exact process or Kubernetes pod that made it. On K8s, enriched with namespace, pod, and container name automatically.
Measure CPU & Memory Per Workload
CPU and memory usage is sampled from the kernel every 60 seconds per process and pod. On Kubernetes, compared against configured resource limits to quantify idle and over-provisioned capacity.
Estimate Costs & Flag Waste
Egress and compute costs are estimated using per-provider pricing matrices. Cross-region transfers, high-volume flows, idle pods, and over-provisioned workloads are automatically flagged.
One-Click Report & PDF
Generate a full cost intelligence report from the dashboard in one click — egress attribution, compute waste, and anomaly flags in a single PDF ready for engineering or finance review.
What Sentrilite Flags
Sentrilite doesn't just show you traffic — it identifies the specific patterns that consistently drive unnecessary cloud costs, across both egress and compute.
⚠ Automatic Cost Anomaly Detection
These patterns are flagged automatically in every Hybrid Cloud Cost Intelligence Report — covering both egress and compute cost waste.
Cross-Region Data Transfer
A service in us-east-1 reading from an S3 bucket in eu-west-1 pays AWS inter-region transfer fees on every byte. Sentrilite identifies exactly which process is making cross-region calls and how much data is involved — the single most common source of surprise cloud bills.
Metadata Service Hammering
Applications that call the cloud metadata service (169.254.169.254) thousands of times per hour are refreshing credentials or instance data far more often than necessary. This is almost always a misconfiguration — credentials should be cached. High call rates indicate wasted compute cycles and potential instability.
Unexpected High-Volume Transfers
A process transferring 10x more data than its peers — or more data than yesterday at the same time — is flagged. This catches both cost anomalies and potential data exfiltration in one signal.
Services Calling Cloud APIs They Shouldn't
If your nginx process is making calls to S3, or your database is calling Lambda, something is misconfigured. Sentrilite flags any process making cloud API calls that don't match its expected role — catching misconfigurations before they become runaway costs.
Multi-Cloud Sprawl
In hybrid and multi-cloud environments, services sometimes end up talking to the wrong cloud — AWS services calling GCP endpoints, or production services calling development cloud accounts. Sentrilite makes this visible at the service level.
Unauthorized Workloads Driving Compute Costs
Crypto miners, runaway processes, and unauthorized workloads consume compute and generate cloud API traffic that shows up as unexplained cost spikes with no obvious cause. Sentrilite detects processes making cloud calls they were never supposed to make — so you know whether that cost spike is a misconfiguration or something that shouldn't be running at all.
Idle Pods Consuming Reserved Capacity
A pod with zero CPU usage that still has memory and CPU limits reserved is paying for capacity it isn't using. Sentrilite identifies every idle pod by namespace, pod name, and container — with the exact dollar cost of the wasted reservation — so your team has a specific list of workloads to scale down or terminate.
Over-Provisioned Workloads
A pod using 10% of its CPU limit is paying for 100% of it. Sentrilite computes CPU and memory efficiency per pod — comparing actual usage against configured limits — and surfaces workloads where limits are set far above what the service actually needs. On a $1,500/week compute bill, 50% over-provisioning is $750 in recoverable spend every week.
Staging & Dev Workloads Running 24/7
Staging databases, development workers, and test environments that run continuously — even outside working hours — are a common source of unnoticed compute waste. Sentrilite shows their CPU and memory cost alongside production workloads, making the comparison impossible to ignore.
Why Tagless Attribution Matters
Most cloud cost tools require you to maintain consistent cost allocation tags across every resource, namespace, and deployment. In practice, tags are incomplete, inconsistent, and never cover 100% of spend. Sentrilite requires no tags at all — attribution comes directly from observing which service makes which call, at the kernel level, regardless of how your resources are labeled.
No Tags to Maintain
Tag-based attribution breaks the moment a resource is deployed without the right labels. Sentrilite never relies on tags — so attribution is always 100% complete from day one.
- No cost allocation tags required
- No label enforcement policies needed
- No untagged spend blind spots
- Works immediately on install — no setup or configuration
Works Outside Kubernetes
Kubernetes cost tools only see what's inside the cluster. Sentrilite works on every Linux server — legacy VMs, bare metal, hybrid on-prem workloads — all in the same report.
- Bare metal servers and VMs fully covered
- Legacy and non-containerized workloads included
- Hybrid on-prem and cloud in one report
- No Helm chart, no sidecar, no Prometheus required
Below the Application Layer
Sentrilite observes at the kernel level — below the SDK, below the framework, below any abstraction. Calls made by third-party libraries, background threads, and auto-scaling events are all captured.
- Captures calls from SDKs and third-party libraries
- Background threads and scheduled jobs included
- No application code changes required
- No cloud billing API credentials needed
What the Report Covers
Tagless Service-Level Attribution
Every service on every monitored server attributed to its cloud spend — with no cost allocation tags, no sidecars, and no instrumentation. Works out of the box from the moment Sentrilite is installed.
- Service name and cloud destination — no tags required
- Call count and data volume per service per destination
- Works on bare metal, VMs, and containers equally
- No Kubernetes dependency — works on any Linux workload
Cross-Region Traffic Analysis
Inter-region data transfer is billed by AWS, GCP, and Azure at premium rates. Sentrilite identifies every cross-region call and the process making it — giving your team a specific target to fix.
- Source region vs destination region for every call
- Estimated transfer volume per cross-region path
- Process responsible for each cross-region pattern
- Flagged as high-priority cost optimization target
Multi-Cloud Visibility
Sentrilite resolves connections to AWS, GCP, and Azure services simultaneously — giving you a single view of cloud traffic across all providers from a single report.
- AWS — S3, DynamoDB, Lambda, EC2, RDS, SQS, SNS
- GCP — Cloud Storage, BigQuery, Pub/Sub, Cloud Run
- Azure — Blob Storage, Cosmos DB, Service Bus, Functions
- Unknown endpoints flagged for review
Node-Level & Fleet-Level Reports
Generate a detailed report for a single server or a rolled-up fleet summary across your entire infrastructure — both available from the same dashboard in one click.
- Single-node report — deep dive into one server
- Fleet summary — top offenders across all nodes
- Comparison view — this week vs last week
- PDF output ready for engineering or finance review
See Exactly Which Service Is Driving Your Cloud Bill
One command to install. One click to generate your Hybrid Cloud Cost Intelligence Report. No tags. No cloud credentials. No code changes.
▶ Get Started — One Command to Install